In middle school I was told that if I didn’t have something nice to say, I shouldn’t say anything at all. Then in high school, I was told to put criticism in a “complaint sandwich”: a healthy bit of criticism tucked in between two delicious slices of flattery and compliments. Yummy! Let’s give that a try here.
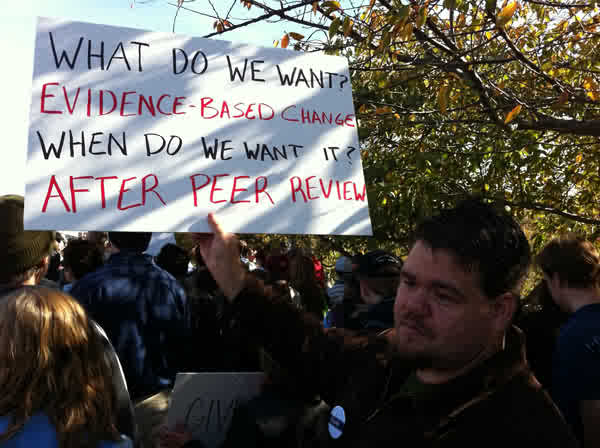
This image has been passed around the development/growth/sustainability/[buzzword] blogosphere over the past several weeks.
The real world can’t run at the glacial pace of peer-review and the academic process, but in large part organizations and universities complement each other. The organizations, GO or NGO, go ahead and do things, and the academics run behind in their dorky tennis shoes and yell “we should study this some more!” When the organization comes back from its adventure crying, there’s a hot-off-the-press working paper sitting on the desk explaining just what mistakes were made and how the author would have done things so much better if only you had listened to them!
So what’s the most important part of evidence-based change? Evidence! The shift towards accountability/results/transparency/[buzzword] in the development industry has led to quantitative evidence and analysis becoming more and more important. Numbers are great. More numbers are better! Luckily for organizations and academics alike, the last twenty years has seen exponential growth in quantitative measure of the things we care about in development. Thanks to organizations like the World Bank, Transparency International, and Freedom House we can now literally put a number on business practices, corruption, democracy etc…
Now for the “meat” of the issue. The proliferation of numbers has in many ways desensitized us to their meanings. I’m going to pick on Transparency International, not because they’re particularly in need of it, but because they make for a good example. TI publishes a yearly Corruption Perceptions Index, that surveys perceptions of corruption around the world. This year marked some big changes, as *gasp* both the USA and UK fell out of the top 20 for the first time. Timor-Leste came in 127th worldwide, with a score of 2.5/10. That’s bad news for those of us rooting for Timor, but it’s also where the big problems with an over-reliance on numbers comes form.
When USAID builds 20 miles of road and OXFAM feeds 20 kids, the numbers are a direct measure of results, but rankings and ratings are different. Corruption is not Olympic diving or figure skating. Attaching a number to “performance” doesn’t carry any intrinsic meaning. For example:
- Are these rankings linear? Is 2 twice as bad as 4?
- Are these rankings intended for comparative purposes at all?
- Where did TI get their numbers from, and are these sources measuring the same thing?
Here is a (slightly defaced) listing of TI’s sources for the index. Officially, TI uses 13 other sources , listed at the top, to compile its index. That enormous white hole in the data means they doesn’t exist.
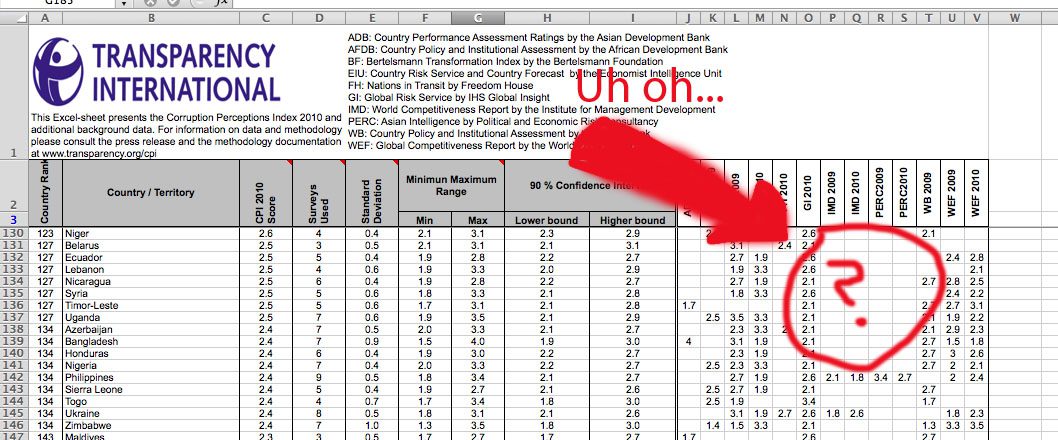
As a matter of fact, Timor’s score was compiled using five sources, not 13. It’s most important neighbor (and the Rosetta Stone of international corruption research) Indonesia had nine sources. Timor-Leste scored 2.5 and Indonesia scored 2.8. Considering the differences in sources, not to mention factors internal to countries, how many comparisons can we possibly draw between the two. Do these numbers mean anything in relation to one another? This is an open question to anyone familiar with corruption in Timor and Indonesia. My suspicion is that the two countries are similar in the same way New York and Los Angeles are both large American cities. If the two are the same, why is New York so much better?
The message here shouldn’t be that TI, or any other organization’s hard work is useless. TI has played a huge part in putting anti-corruption efforts on the development agenda, and made a very useful introductory guide to corruption around the world. The problem is the numbers tend to be used both as precise measures and as devices of comparison, when they are not intended (or should not be intended) to be used as either. These indices are broad and blunt tools. The more precise measures come from local knowledge, and unfortunately you can’t put a number on that.
P.S. For those looking for a “local” approach to anti-corruption have a look at globalintegrity, whose managing director Nathaniel Heller inspired this post.
More from this author -
Latest News -

PDT – First Annual Plan of Action
Uncategorized

New assistance for local businesses available from Peace Dividend Trust
Uncategorized


![[Press Release] Building Markets Awarded Grant from the Nasdaq Foundation to Empower Women Entrepreneurs in Colombia](https://buildingmarkets.org/wp-content/uploads/2024/03/Nasdaq-Partnership-Announcement-2.jpg)